2 Data
2.1 Data Sources
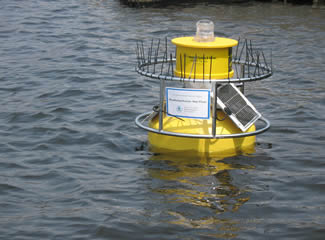
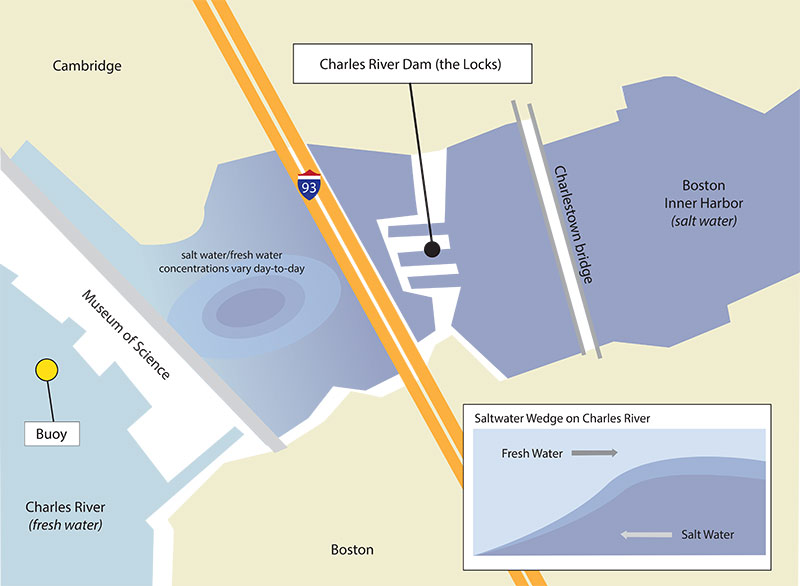
2.1.1 EPA Water Quality Buoy placed in the Lower Charles River
Every 15 minutes, this self-contained solar powered buoy takes measurements for temperature, dissolved oxygen, pH, specific conductance, turbidity, chlorophyll, and phycocyanin. The sensors on the buoy are located 1 meter below the water’s surface. The data are transmitted in real-time using telemetry for remote access. The data from this buoy is used to assess water quality conditions and to help track cyanobacteria (blue-green algae) blooms.
2.1.2 Visual Crossing Historical Weather Data API
Visual Crossing is a provider of weather data and enterprise analysis tools to data scientists, business analysts, professionals, and academics. Founded in 2003, this weather data API leads the industry by providing the lowest-cost access to all types of historical weather data, weather forecasts, climate summaries, and historical weather forecasts.
2.2 Missing Data Analysis
- Fecal bacteria data is not measured by the Charles River Buoy (e.g. enterococci samples).
- Buoy data is only reported between May and October. There is no data for November through April.